-
Mortgage Lending In The Asian American And Pacific Islander Community
Key Findings
- Over 652,000 loan applications were reported in 2018 where the applicant identified as AAPI.
- Home purchase loans varied greatly within the AAPI community, with Asian Indians purchasing homes in 70% of cases, compared with Japanese borrowers that purchased a home just 45% of the time.
- There are substantial variations in the share of home purchase loans to younger borrowers across different AAPI groups. This wide variation will have an impact on pricing of the loan, since younger borrowers tend to have less cash for down payments, lower incomes and weaker credit.
- Asian Indian and Chinese homebuyers rarely use non-conventional loans to fund their purchases while Filipino and HoPI borrowers were much more likely to do so.
- On average, AAPI homebuyers that used a mortgage company as opposed to a bank to fund their home purchase paid almost $1,800 more at the closing table.
Introduction
The 2018 Home Mortgage Disclosure Act (HMDA) data included expanded racial data for the first time, including sub-groups of the census categories of Asian American and Native Hawaiian and Pacific Islander (which we collectively refer to as AAPI). Lenders were asked to collect data on which racial sub-group borrowers identified within their mortgage applications in 2017, resulting from the 2015 HMDA Rule by the Consumer Financial Protection Bureau (CFPB). Hispanic, Asian and Hawaiian or Pacific Islander (HoPI) borrowers now have the option to identify up to five sub-categories. For AAPI applicants this means that they can choose from a list of different groups.
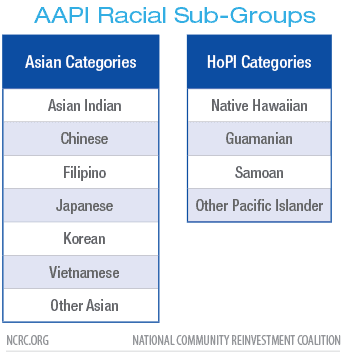
These are the optional sub-groups that AAPI applicants can identify as when they apply for a loan. They can choose up to 5 of these categories. During the rulemaking process, the CFPB received several comments from industry members that collecting this data would somehow discourage applicants or expose the lenders to unfounded accusations of impropriety. In fact, the data collection has been very popular with applicants. In the first year, over 60% of applicants that qualified voluntarily chose at least one relevant sub-group. Clearly, applicants did not feel the question was problematic.
In this short analysis, we examined the HMDA records for AAPI loan applicants, with particular attention to the variations in loan originations, features and costs between different AAPI groups. This descriptive analysis was intended to better understand the gaps in our understanding of structural or other factors that drive variations in how specific members of these vital communities are treated in the mortgage market.
Data And Methods
The expanded racial data is the result of many years of advocacy by the National Community Reinvestment Coalition (NCRC), the National Coalition for Asian Pacific American Community Development (National CAPACD) and many other organizations seeking to measure outcomes more effectively by race. AAPIs are extremely diverse, with more than 50 ethnic groups. Within the AAPI community, there exists extreme income inequality with the top 10% of AAPIs making 10.7 times more than the bottom 10%, according to a recent study by the Pew Research Center. As a result, looking at disaggregated data by racial sub-groups and income is critical to better understanding this population and its unique position in the mortgage landscape in the United States.
A detailed review of the 2018 mortgage application data reported by the CFPB showed that the lending experience of AAPI mortgage applicants was anything but uniform. Different sub-groups show wildly different results and pricing for the loans they received.
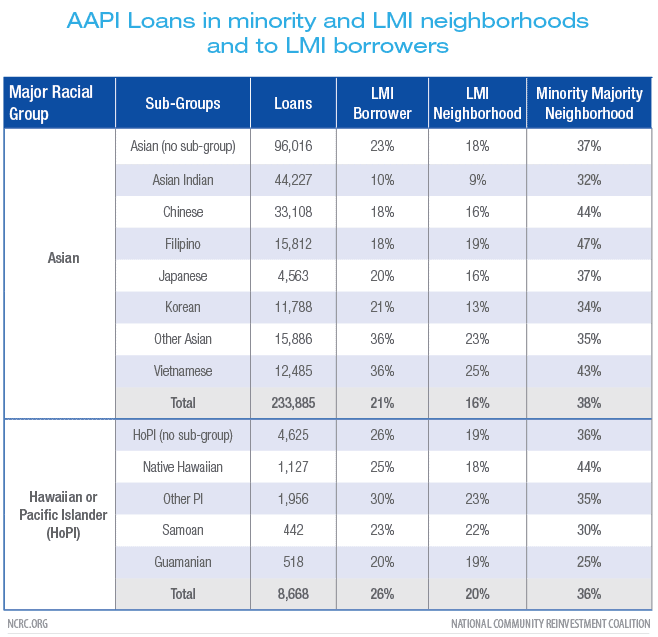
Over 652,000 loan applications were reported in 2018 where the applicant identified as AAPI. HMDA divides the AAPI community into two main component groups, Asian and Hawaiian or Pacific Islander (HoPI). Sub-group choices allow us to break each of these main categories down more precisely. The option to do so has proven a popular one among loan applicants. Asian borrowers selected at least one sub-group in 60% of originations, while 50% of HoPI borrowers did so.
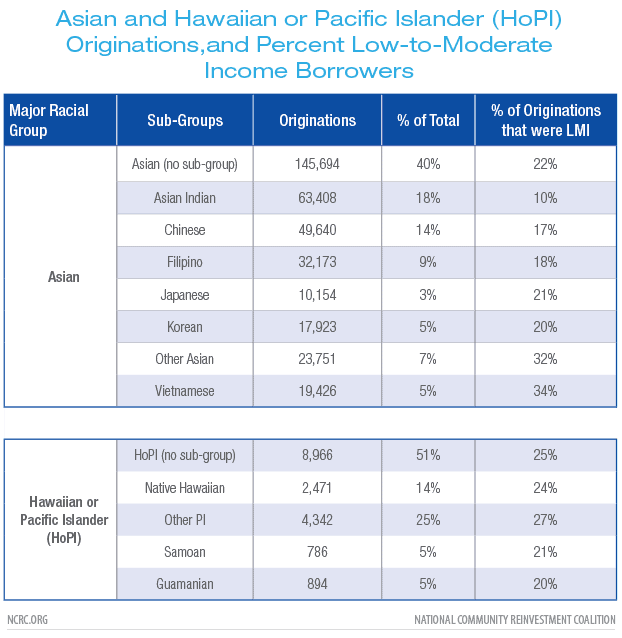
Owner occupied, site built, 1-4 family homes HMDA 2018. Originations and application reported to HMDA are included, preapprovals and purchased loans are excluded.
Unless noted otherwise, the following analysis focused on the AAPI applicants for home purchase loans on owner occupied, site built homes with 1-4 units that chose a sub-group.
Loan Purpose And Characteristics, Borrower Age And Income, Loan And Lender Type
Home purchase loans nationally in 2018 accounted for 56% of all loans. Amongst AAPI groups this varied greatly, with Asian Indians purchasing homes in 70% of cases, compared with Japanese borrowers that purchased a home just 45% of the time. Loans that extracted equity from the home were utilized at higher rates among some groups. Across all AAPI borrowers, loans that extracted equity from the home, including cash-out refinances, home equity and home improvement loans, accounted for just 24% of loans. Some groups were far more likely to take advantage of the equity in their homes than others in 2018.
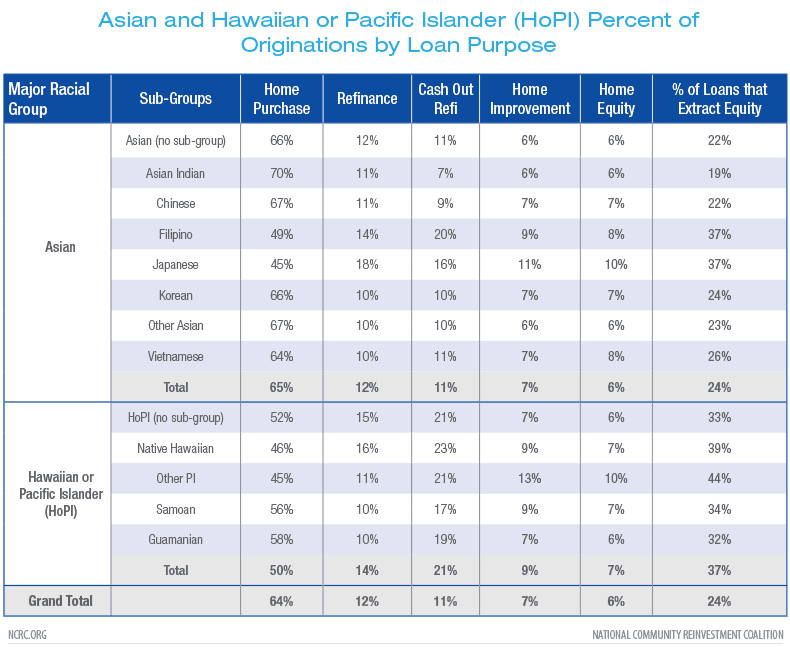
Originations on owner occupied, site built, 1-4 family homes HMDA 2018.
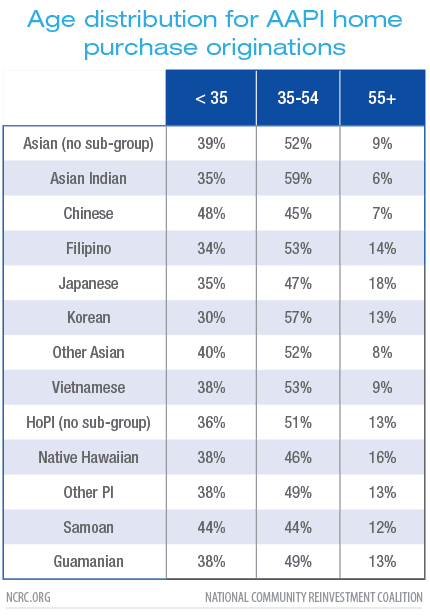
A key driver of home lending is the age of the borrowers. In 2018, HMDA expanded for the first time to publicly report the age of the applicant.
There are substantial variations in the share of home purchase loans to younger borrowers across different AAPI groups, with 48% of Chinese borrowers being under the age of 35. Compared with that, 18% of Japanese borrowers were over 55 in 2018. This wide variation will have an impact on pricing of the loan, since younger borrowers tend to have less cash for down payments, lower incomes and weaker credit.
In part, this age difference is driven by patterns of migration and the length of time specific sub-groups have been present in the United States, but it may also reflect the presence of lending institutions that specifically target or market to the AAPI sub-groups.
Originations on owner occupied, site built, 1-4 family homes HMDA 2018. Another way in which AAPI home purchase borrowers differed starkly is in their income. The applicant income level is determined by dividing the amount of annual income reported on the loan application by the area median family income (AMI) for the metro area. Lower-income applicants earn less than or equal to 50% of the AMI, while moderate-income borrowers reported less than or equal to 80% of AMI. Collectively, these are referred to as low- and moderate-income (LMI) borrowers. Middle-income borrowers can earn up to 120% of AMI, and above that are upper-income earners.
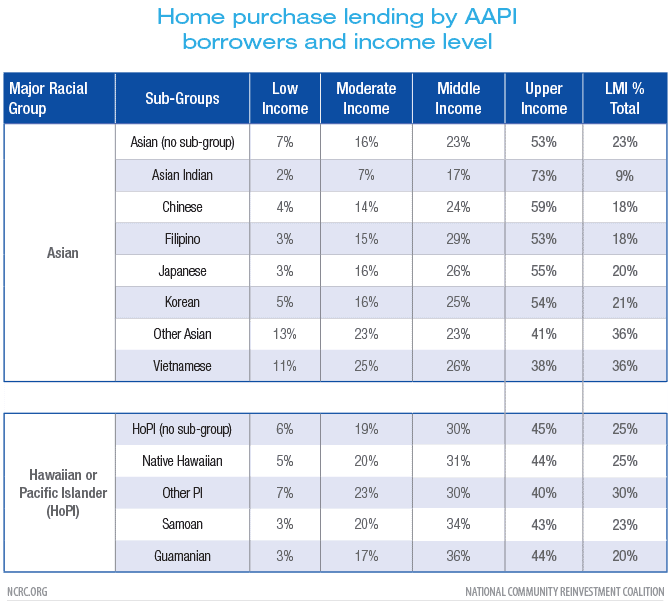
Originations on owner occupied, site built, 1-4 family homes HMDA 2018. Asian Indian applicants reported that they were upper-income in 73% of home purchase originations. By contrast, 36% of other Asian and Vietnamese borrowers were considered LMI.
Income can have a strong influence on the choice of loan and lender type as well. These are important factors in determining the experience a borrower will have and how much they will pay for their loan. Below is excerpted from the NCRC research report on lending to same-sex couples:
Mortgage companies, banks and credit unions all offer mortgages for homebuyers but they are not all the same nor do they necessarily offer the same products. Mortgage loans are broadly limited main products. Conventional loans are mortgages made by banks without any additional insurance in case of default. They tend to offer lower rates and closing fees in exchange for requiring more money for down payment and better credit. The FHA loan program administered by HUD offers loans insured by the Federal government, in case of default the principle of the loan is paid to the lender. Lowering the risk in this way allows these loans to offer smaller down payments but the closing fees and interest rates associated with them are often larger than conventional loans. These distinctions are important. Since the Great Recession from 2007-2009, banks have largely withdrawn from the FHA/VA/RHS market. Although there are conventional loan products such as the Fannie Mae Home Ready program that mimic the low down payment requirements of the FHA program, they have not proven to be as popular as FHA loans with borrowers and loan originators. Therefore, borrowers that are more likely to need an FHA loan, who are disproportionately younger/first-time borrowers and LMI or minority, are often unable to secure home mortgage financing through a bank or credit union.Mortgage companies consistently report both higher interest rates and closing costs on the loans that they make. In 2018 when looking at all homebuyers who used a mortgage company to fund their purchase, we found that they paid an average of $2,100 more than those borrowers who used a bank and $2,800 more than credit union borrowers. Since mortgage companies are the primary source for loans needed by younger borrowers, they are often over-represented in the loan applications to those borrowers.
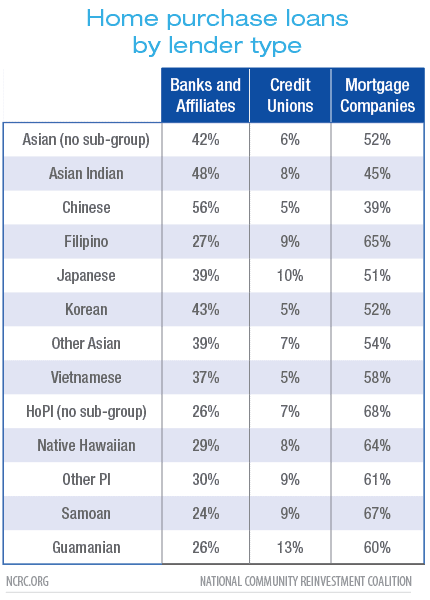
In 2018, independent mortgage companies made 57% of all loans in the United States. Among AAPI home purchase borrowers, a wide variation is observed as well.
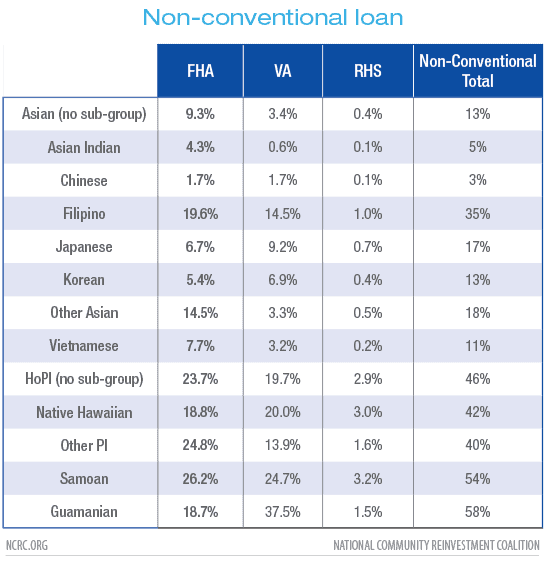
Originations on owner occupied, site built, 1-4 family homes HMDA 2018. Some AAPI sub-groups are far less likely to use non-conventional loans to fund their home purchases. Offered by the Department of Housing and Urban Development, the Veterans Administration and the Department of Agriculture, these loans offer lower down payment requirements and easier credit requirements but often cost the borrower more in closing fees and interest rates. Asian Indian and Chinese homebuyers rarely use non-conventional loans to fund their purchases while Filipino and HoPI borrowers were much more likely to do so.
Originations on owner occupied, site built, 1-4 family homes HMDA 2018. Loan Costs And Interest Rates
Closing costs associated with loan origination can be the biggest barrier facing many homebuyers. These costs include items such as fees for appraisals and credit checks, discount points the borrower pays to lower the interest rate of the loan and any credits the lender gives to the borrower.
Interest rates are higher for borrowers that use mortgage companies as well. HMDA reports the interest rate that the borrower pays but since rates vary throughout the year we measure interest rates by comparing them with the average interest rate reported on the day the loan is closed. This is referred to as the rate spread, and is expressed in basis points. A basis point is valued at .01%, so a rate spread of 50 means that the borrower was charged an interest rate .5% higher than the average of every other borrower that closed on their loan on that day.
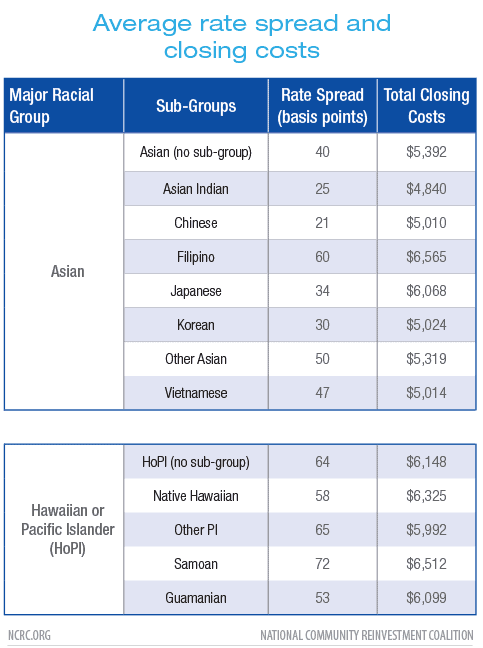
Home Purchase originations on owner occupied, site built, 1-4 family homes HMDA 2018. Average figures. Outliers have been excluded. These average rates and costs mask substantial differences based on the type of lender and the type of loan that is used to fund a home purchase. Mortgage companies and government insured loans typically cost more, both in interest and fees, than conventional lending usually offered by banks.
There are consequences for communities that rely on mortgage companies and nonconventional loans. The differences in closing costs and interest rates are dramatic and have long-term consequences for the ability of the borrower to build equity.
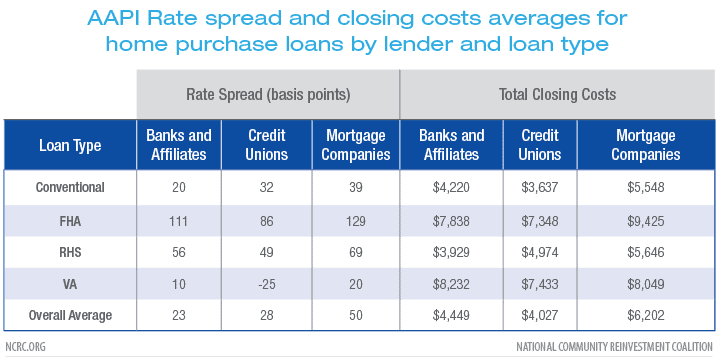
Home Purchase originations on owner occupied, site built, 1-4 family homes HMDA 2018. Average figures. Outliers have been excluded. On average, AAPI homebuyers that used a mortgage company as opposed to a bank to fund their home purchase paid almost $1,800 more at the closing table. These costs vary greatly between types of lenders, with home purchase closing fees paid by AAPI borrowers averaging $6,202 for mortgage companies in 2018. Compared with banks that charged $4,449 and credit unions $4,027, the mortgage companies are far more expensive. While some of this cost can be associated with the borrower using discount points and origination fees to buy down their loan rate, the interest rates are actually higher for mortgage company borrowers as well.
Some AAPI communities are more likely to use mortgage companies and the nonconventional loans that they offer. Part of the reason that some AAPI groups may gravitate toward mortgage companies is their willingness to make the kinds of loans these groups need. Banks have largely withdrawn from making loans insured by the government, including FHA, VA and RHS loans. The specific AAPI groups that are more likely to use a mortgage company are also more likely to seek these kinds of loans although it is likely that some lenders will steer applicants to loan programs that offer the lender the highest profit.
Mortgage companies and banks may also specialize in marketing and outreach to Asian communities, with advertisements and staff from the community to bridge cultural and language barriers. Some banks have followed suit as well and some immigrant communities have been supported by American branches of banks from their country of origin.
Loan characteristics vary greatly among AAPI groups, with some groups far more likely to buy homes in LMI tracts. Vietnamese, “Other Asian” and “Other Pacific Islander” populations show the highest rates of purchases in LMI neighborhoods. These “Other” groups potentially represent more recent immigrants and refugee populations or growing cultural districts.
Home Purchase originations on owner occupied, site built, 1-4 family homes HMDA 2018. Top Metro Areas
The ten metros that were home to the most AAPI home purchases in 2018 saw 47% of all AAPI home purchase loans nationally.
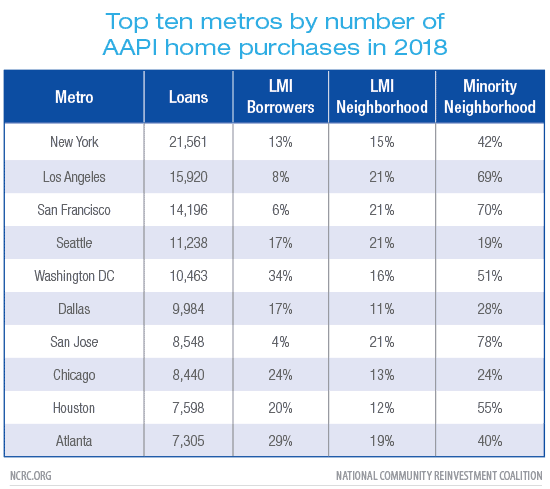
Home Purchase originations on owner occupied, site built, 1-4 family homes HMDA 2018. In particular, the variation across different metros in the ability of LMI borrowers to make a home purchase is problematic. In the three metros located in California, LMI borrowers are virtually excluded from home ownership. In all three of those cities, the borrowers that do make purchases are overwhelmingly likely to purchase in a majority minority neighborhood.
Specific markets show substantial variation in the AAPI communities that are buying homes as well. Among the five metropolitan areas with the largest number of AAPI buyers we see differences in the market share of each group.
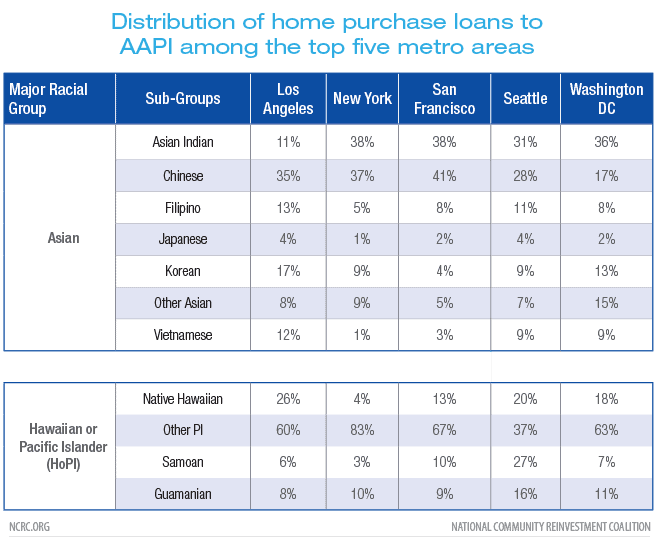
Home Purchase originations on owner occupied, site built, 1-4 family homes HMDA 2018. The experience and growth of specific AAPI sub-groups in different cities is well documented. In Seattle, Asians are the fastest growing minority group, and this city also features a fast growing Vietnamese population. Meanwhile, in New York City the “Other Asian” category includes rapidly expanding groups such as Bangladeshi and Nepalese.
Discussion
With the advent of 2018 HMDA data, a new and exciting possibility exists to research mortgage lending and discrimination among the various communities within the AAPI universe. Very little literature exists on the experience of AAPI communities and the mortgage market, and we hope that this short analysis will highlight the need for research in this area. In particular, AAPI lending likely has strong regional variations based on the settlement patterns of particular sub-groups and the length of time those communities have been in the U.S. As the fastest growing racial group in the country, with extreme income and ethnic diversity, Asian Americans and Pacific Islanders are often widely misunderstood by policy makers and industry leaders. If we are to better serve these communities and ensure equitable access to good credit, it is clear that there is a need to look closer within specific markets and by ethnic population. A simple look at Asian Americans and Pacific Islanders using national level data does not reveal the critical differences in populations and markets. Instead, to get a clear picture of how this diverse community is accessing credit – it is necessary to look within specific geographic markets and disaggregate by ethnicity.
The collection of the HMDA data by sub-group is an important advancement in gaining a better understanding of this community. This valuable lending data shows different AAPI community experiences with home mortgage lending, and enables a close look at the needs in specific markets, reveals settlement patterns and the economic impact.
There is still substantial pressure from the industry to restrict the collection of this data. In 2018, Congress successfully rolled back the reporting of some of the expanded data required by the Dodd Frank Act for smaller lenders. Lenders have often complained that this data represents a burden to collect. Borrowers appear to disagree. In the 2019 HMDA data recently released by the CFPB, 68% of Asian respondents and 58% of Hawaiian or Pacific Islanders that applied for a loan selected at least one sub-group. It does not appear that loan applicants find this to be a burden. This data collection should not only be preserved but expanded to all ethnic groups such as the African and Caribbean populations.
National CAPACD is the first and only national HUD housing counseling intermediary specifically dedicated to serving low-income Asian American and Pacific Islander tenants, homebuyers and homeowners in the United States. National CAPACD, in partnership with the UCLA Asian American Studies Center, will release a research report entitled Centering Culture: 10 Years of Building the AAPI Voice in the Housing Counseling Industry. This report will analyze the needs of and opportunities for AAPI homebuyers and renters and celebrate the unique role of National CAPACD’s network in the housing counseling field. The report is scheduled to be released in August 2020.
NCRC and its 600 members organizations work together to further the cause of economic equality and fair lending. Members of NCRC have access to the NCRC research team that worked on this report and can request custom research of their communities. Please contact us with any questions on membership.